
Explore actions
Dashboard
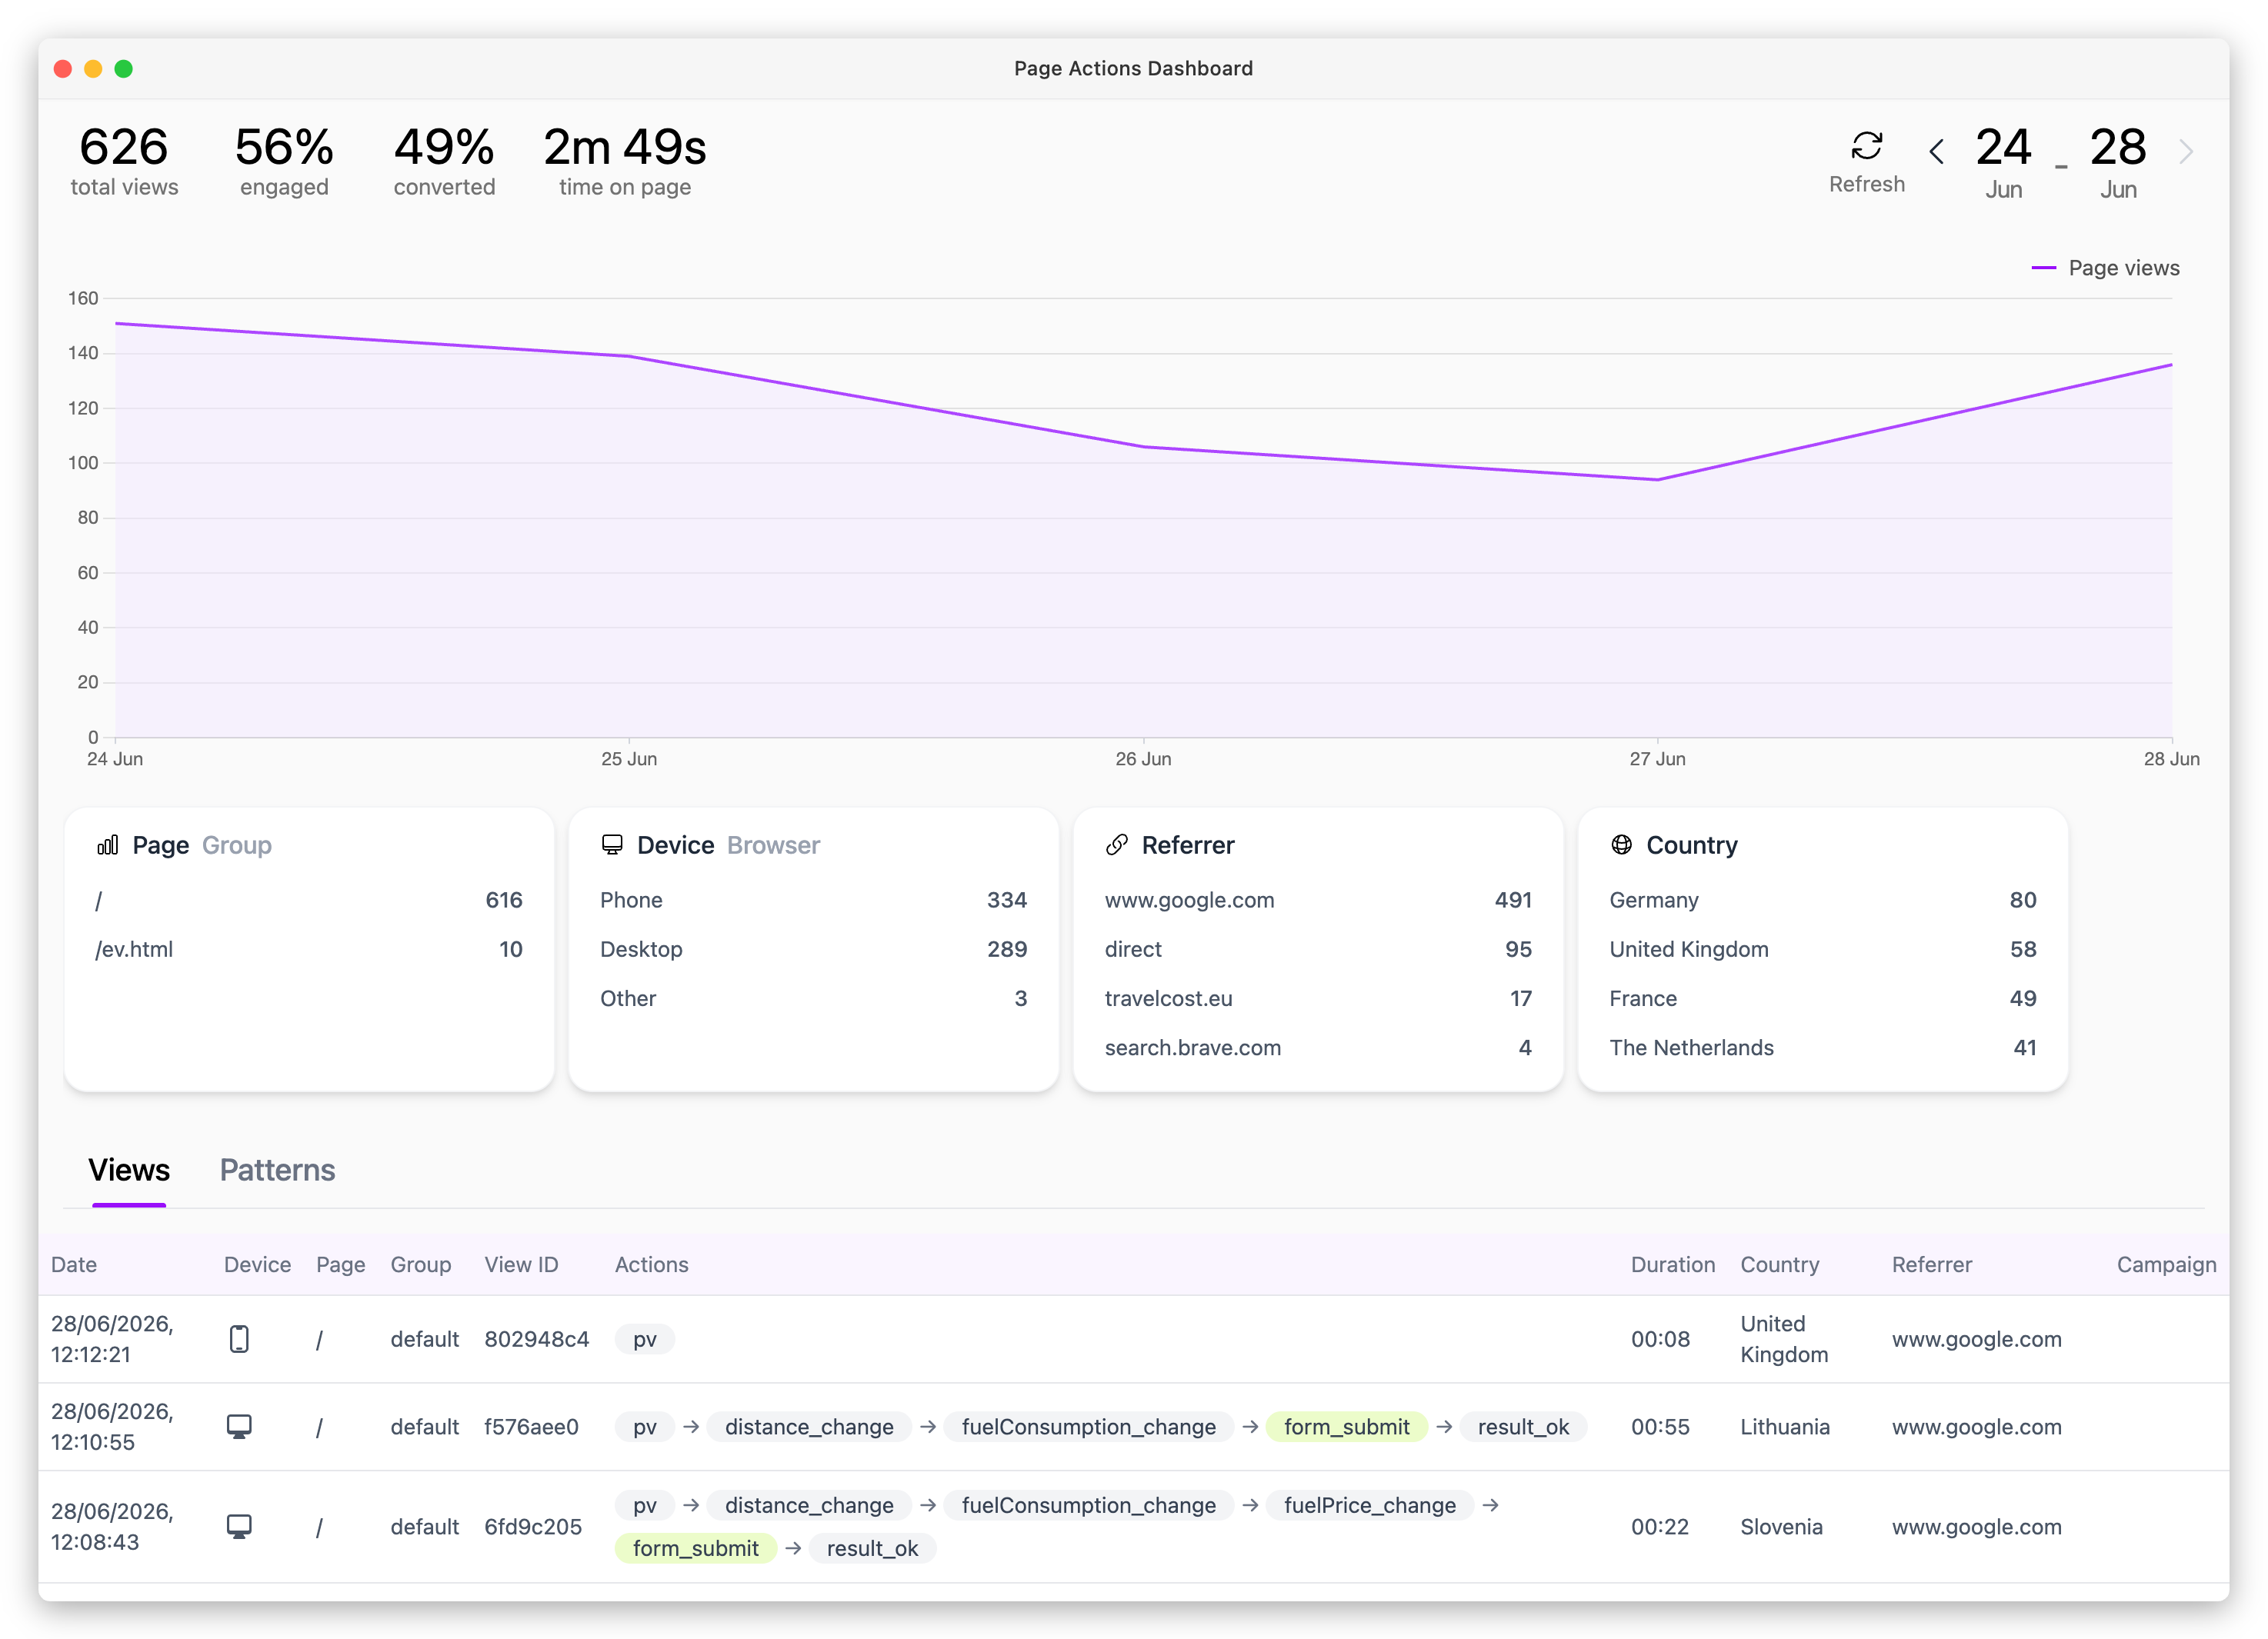
The Page Actions' dashboard is a place where you can explore and query all collected page actions from your sites.
You can access the dashboard by visiting the URL https://app.page-actions.com/dashboard after a successful logon.
Site picker
At the top of the dashboard page there is a site picker that allows you to choose which site's data are being presented.
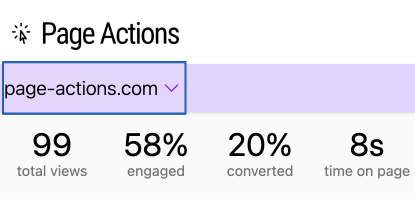
When your account has more than one site configured, then next to the active site ID, there is a dropdown arrow presented. The context menu containing all sites opens when you click it, allowing you to change the active site.
Date filter
The date filter on the right-hand side of the dashboard page allows you to select a time range for data you would like to explore.
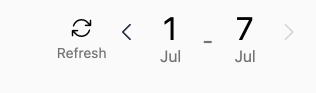
You can select a single day or a date range.
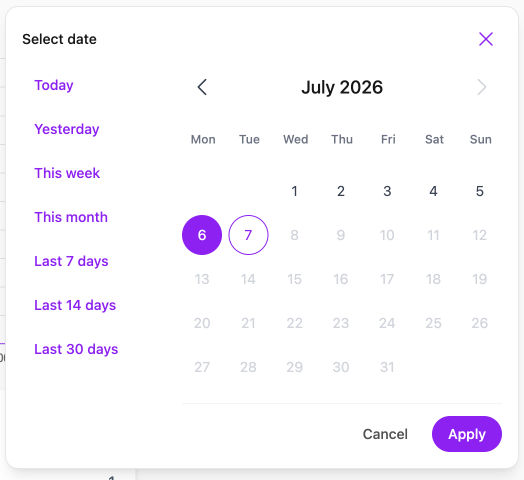
Clicking on the dates opens a menu to select a new date range. You can select a common preset like today or this week or use a calendar to select a custom range.
There is also a refresh button that reloads all the site's data without reloading the whole page.
Quick summary
The quick summary shows the most important numbers describing the performance of the site during the selected date range.

It consists of 4 metrics:
- Total number of page views
- Share of engaged page views (click to switch to the number of engaged page views)
- Share of page views with conversion action (click to switch to the number of page views with conversion)
- Average time the user spent on page
Aggregation filters
The aggregation filters show your traffic aggregated by various dimensions. It consists of 4 cards with multiple ways to group and filter collected data.
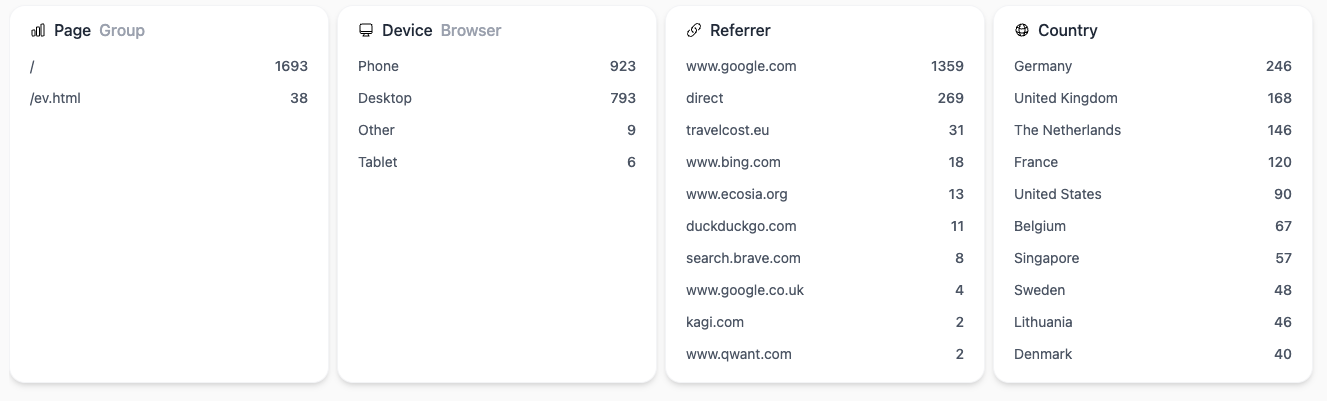
Each dimension shows the 10 most popular values with the number of page views. You can narrow down presented data by clicking the row with a given value. To remove the filter click the "Clear" button.
Currently the following aggregations are available:
- Page path
- Page Actions group
- User's device type
- User's browser name
- Referrer domain
- User's country
Page views table
The page views table presents all recorded page displays that occurred during the selected data range. The most recent visits are presented at the top of the table.
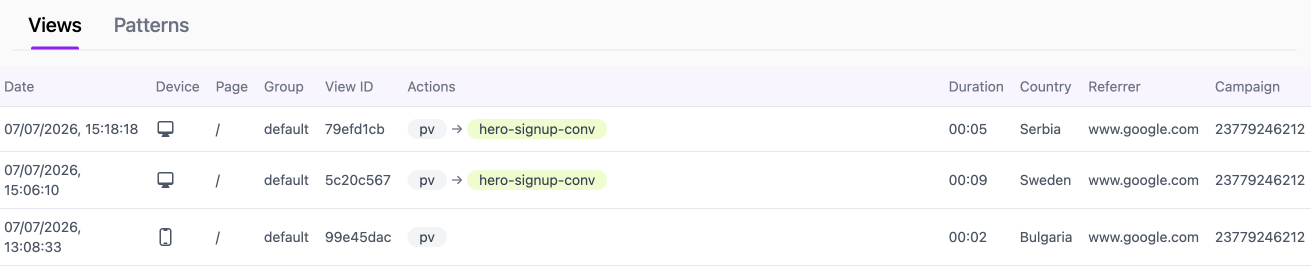
The column Actions presents the sequence of recorded page actions in chronological order. The first page action is called "pv" and it represents a page visit and the optional custom actions follow. The conversion actions are presented with a light green background.
Actions panel
The Actions panel displays the most frequently reported actions within the selected date range. It shows the 10 actions with the highest number of occurrences. The Page View action is excluded because it is recorded for every reported page view.
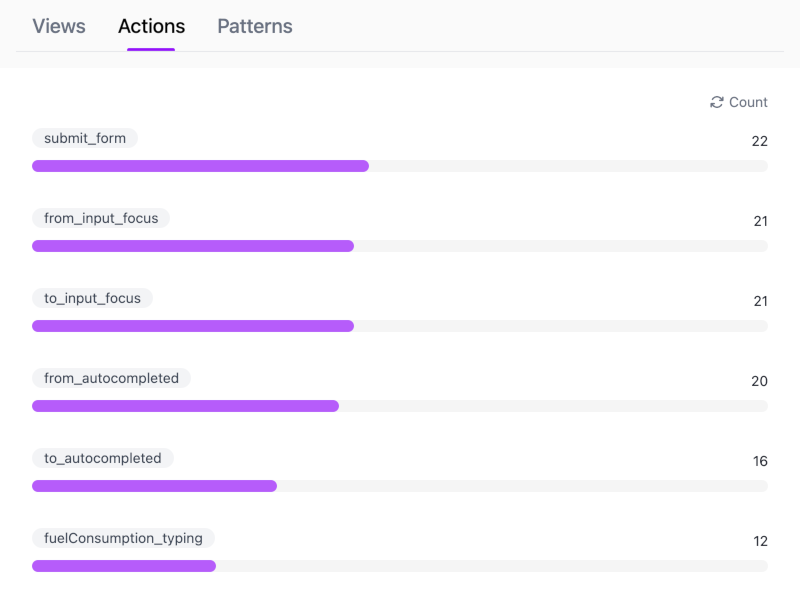
By default, the total event count is displayed in the rightmost column. You can switch to Count/Page Views mode by clicking the column header. In this mode, the action count is divided by the total number of page views and displayed as a percentage. The displayed value may exceed 100% because some actions can happen multiple times during a single page view.
Patterns panel
The action pattern is a chain of actions in specific order. This panel shows the most frequent user behavior patterns on selected pages. This is very useful to learn how the users use your page.
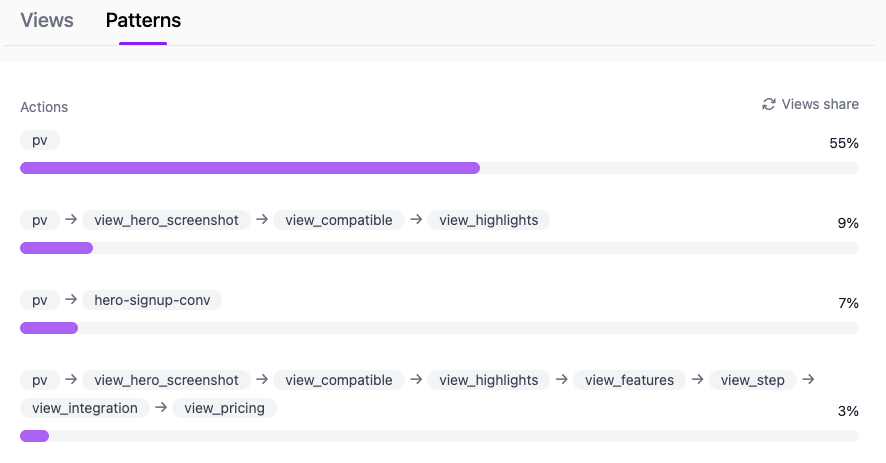
This panel presents the 10 most popular action patterns along their share in total page views within the selected date range. You can change the mode to the number of occurrences by clicking the column header.